[IQA #6] Optic Disc/Fovea angles distribution in BRSet
In this post, we will be talking about the angle distribution for the retinal structures in the BRSet dataset, which is fundamental to our research.
Recently, I made a post talking about how we calculated the distance between the Optic Disc and the Nasal Edge, and from the Macular Center to the Temporal Edge of the retina. It turns out that, even though we were correct by applying the algorithm we did, considering the angle position between the two structures, due to the fact that in some images the angle is too high or the structures are poorly located far from the center of the retina, we have never discussed why this approach truly necessary. In this post, we will be covering that.
How to calculate the angle between Fovea and OD
We have now been using the fovea center and OD center points, in order to calculate the unit vector \(\vec{U}\), which we use to determine the Nasal Point, not an anatomical term, but a point we have defined as the closest point in the optic disc to the nasal edge. For that, we had an approach that calculated the angle between the two structures, and chose the nasal point as the one given by the ellipse parametrical equation and maximized \(xs * ux + ys * uy\). However, even though this angle calculation is correct, it may vary according to the eye the image was taken from, since the left eye gives an image orientation and the right eye gives another, making it hard to understand and obtain some information from it.
Knowing this context, and the fact that the angle should be approximately 6°, we needed a better approach to calculate the angle \(\theta\) between the two structures. For that, take a closer look at the image:
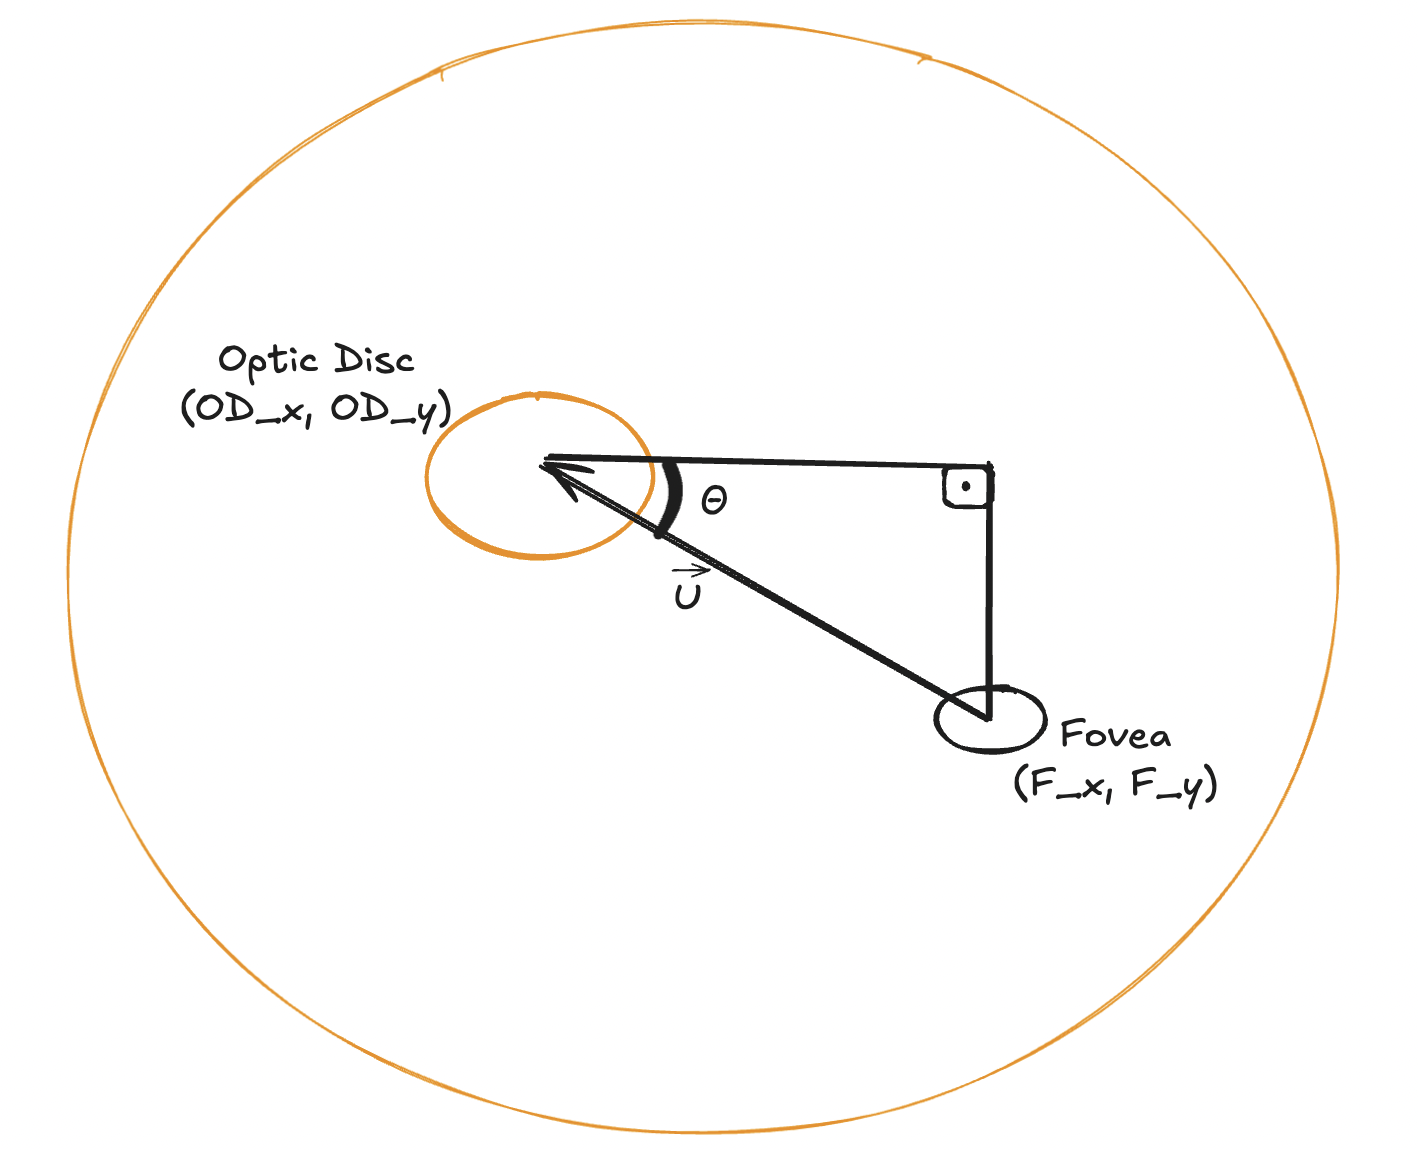 A retinal schema showing how we are going to calculate the angle
This image states that we can, given the two structural reference points, define a arbitrary point \((F_x,OD_y)\), in order to determine a right-angled triangle. Now we can just use a geometrical approach in order to determine the angle \(\theta\) given in the image. Notice that, if the image is inverted, the only thing we need to do is calculate the size of the cathets as an absolute value, and the algorithm should work the same way.
\[\theta = arctan(|F_x - OD_x|, |F_y - OD_y|)\]The \(arctan\) function may be calculated using the python math library. With that, we were able to calculate the angle \(\theta\) (in degrees) for all BRSet images and join this value with our previous statistics, generated for all images after detections. This was also covered in a previous post.
Angles distribution
So now, we need to assess that our approach, considering the angle between the fovea and the optic disc, in order to calculate the distance from these structures to the retinal edges, is indeed necessary, instead of just calculating the horizontal distance. For that, we have plotted the following histogram:
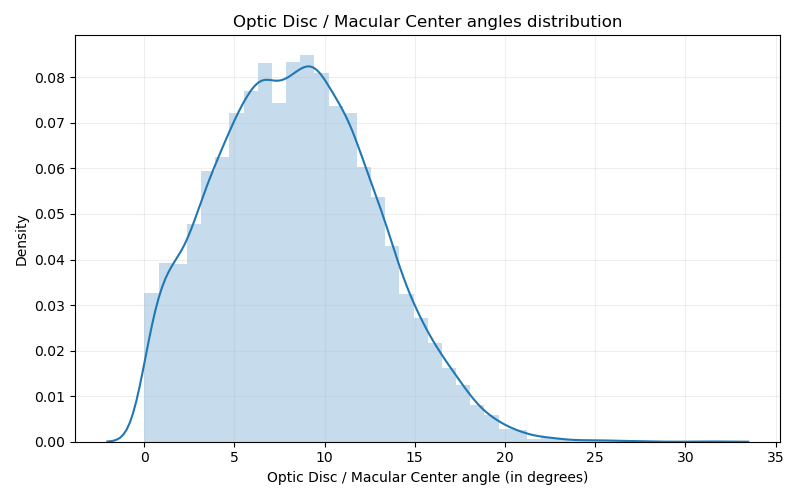 OD/Fovea angle distribution for all the BRSet images
From this histogram, we can see that a high percentage of the images in the dataset present a high-valued angle between the two structures, greater than 6°, mentioned previously in this post. From this, we can say that our approach considering this angled approach to calculate the distances is justfied on the data distribution for the dataset, as we should have done before.
Next Steps
Given this, we have presented some strong results concerning the image field analysis for BRSet, that may be explored in the future by me or other researchers. I will be running all the results obtained by my advisor, in order to check if there is something else that may be explored, but for now our work is done. The paper for SIBGRAPI has its first version finished, and will also be reviewed by my advisor, before submitting it to the event. Hopefully, our work has a strong scientific contribution and will be accepted :)
- Understanding and studying the problem
- Choosing dataset
- Preprocessing data
- Define training baseline
- Applying YOLO to detect Optic Disc (OD)
- Obtaining the disc diameter (DD)
- Obtaining distance from the OD to the Nasal Edge
- Detect Macular Center
- Obtaining the distance from the Macular Center to the Temporal Edge
- Run statistical analysis on BRSet
- BRSet image field label distributions
- OD/Fovea angle distribution
- Paper submission for SIBGRAPI
- Assessing visibility for the inferior and superior arcades
This post is used as a research checkpoint for the image quality assessment research on retinal fundus images, supervised by professor Nina S. T. Hirata, from the Institute of Mathematics and Statistics at the University of São Paulo (IME USP). The project is supported by USP/MCTI/Softex/Motorola.