[IQA #4] Fovea Detection using YOLO
This post will cover the chosen technique to detect fovea for IQA purposes, by processing data and using YOLO.
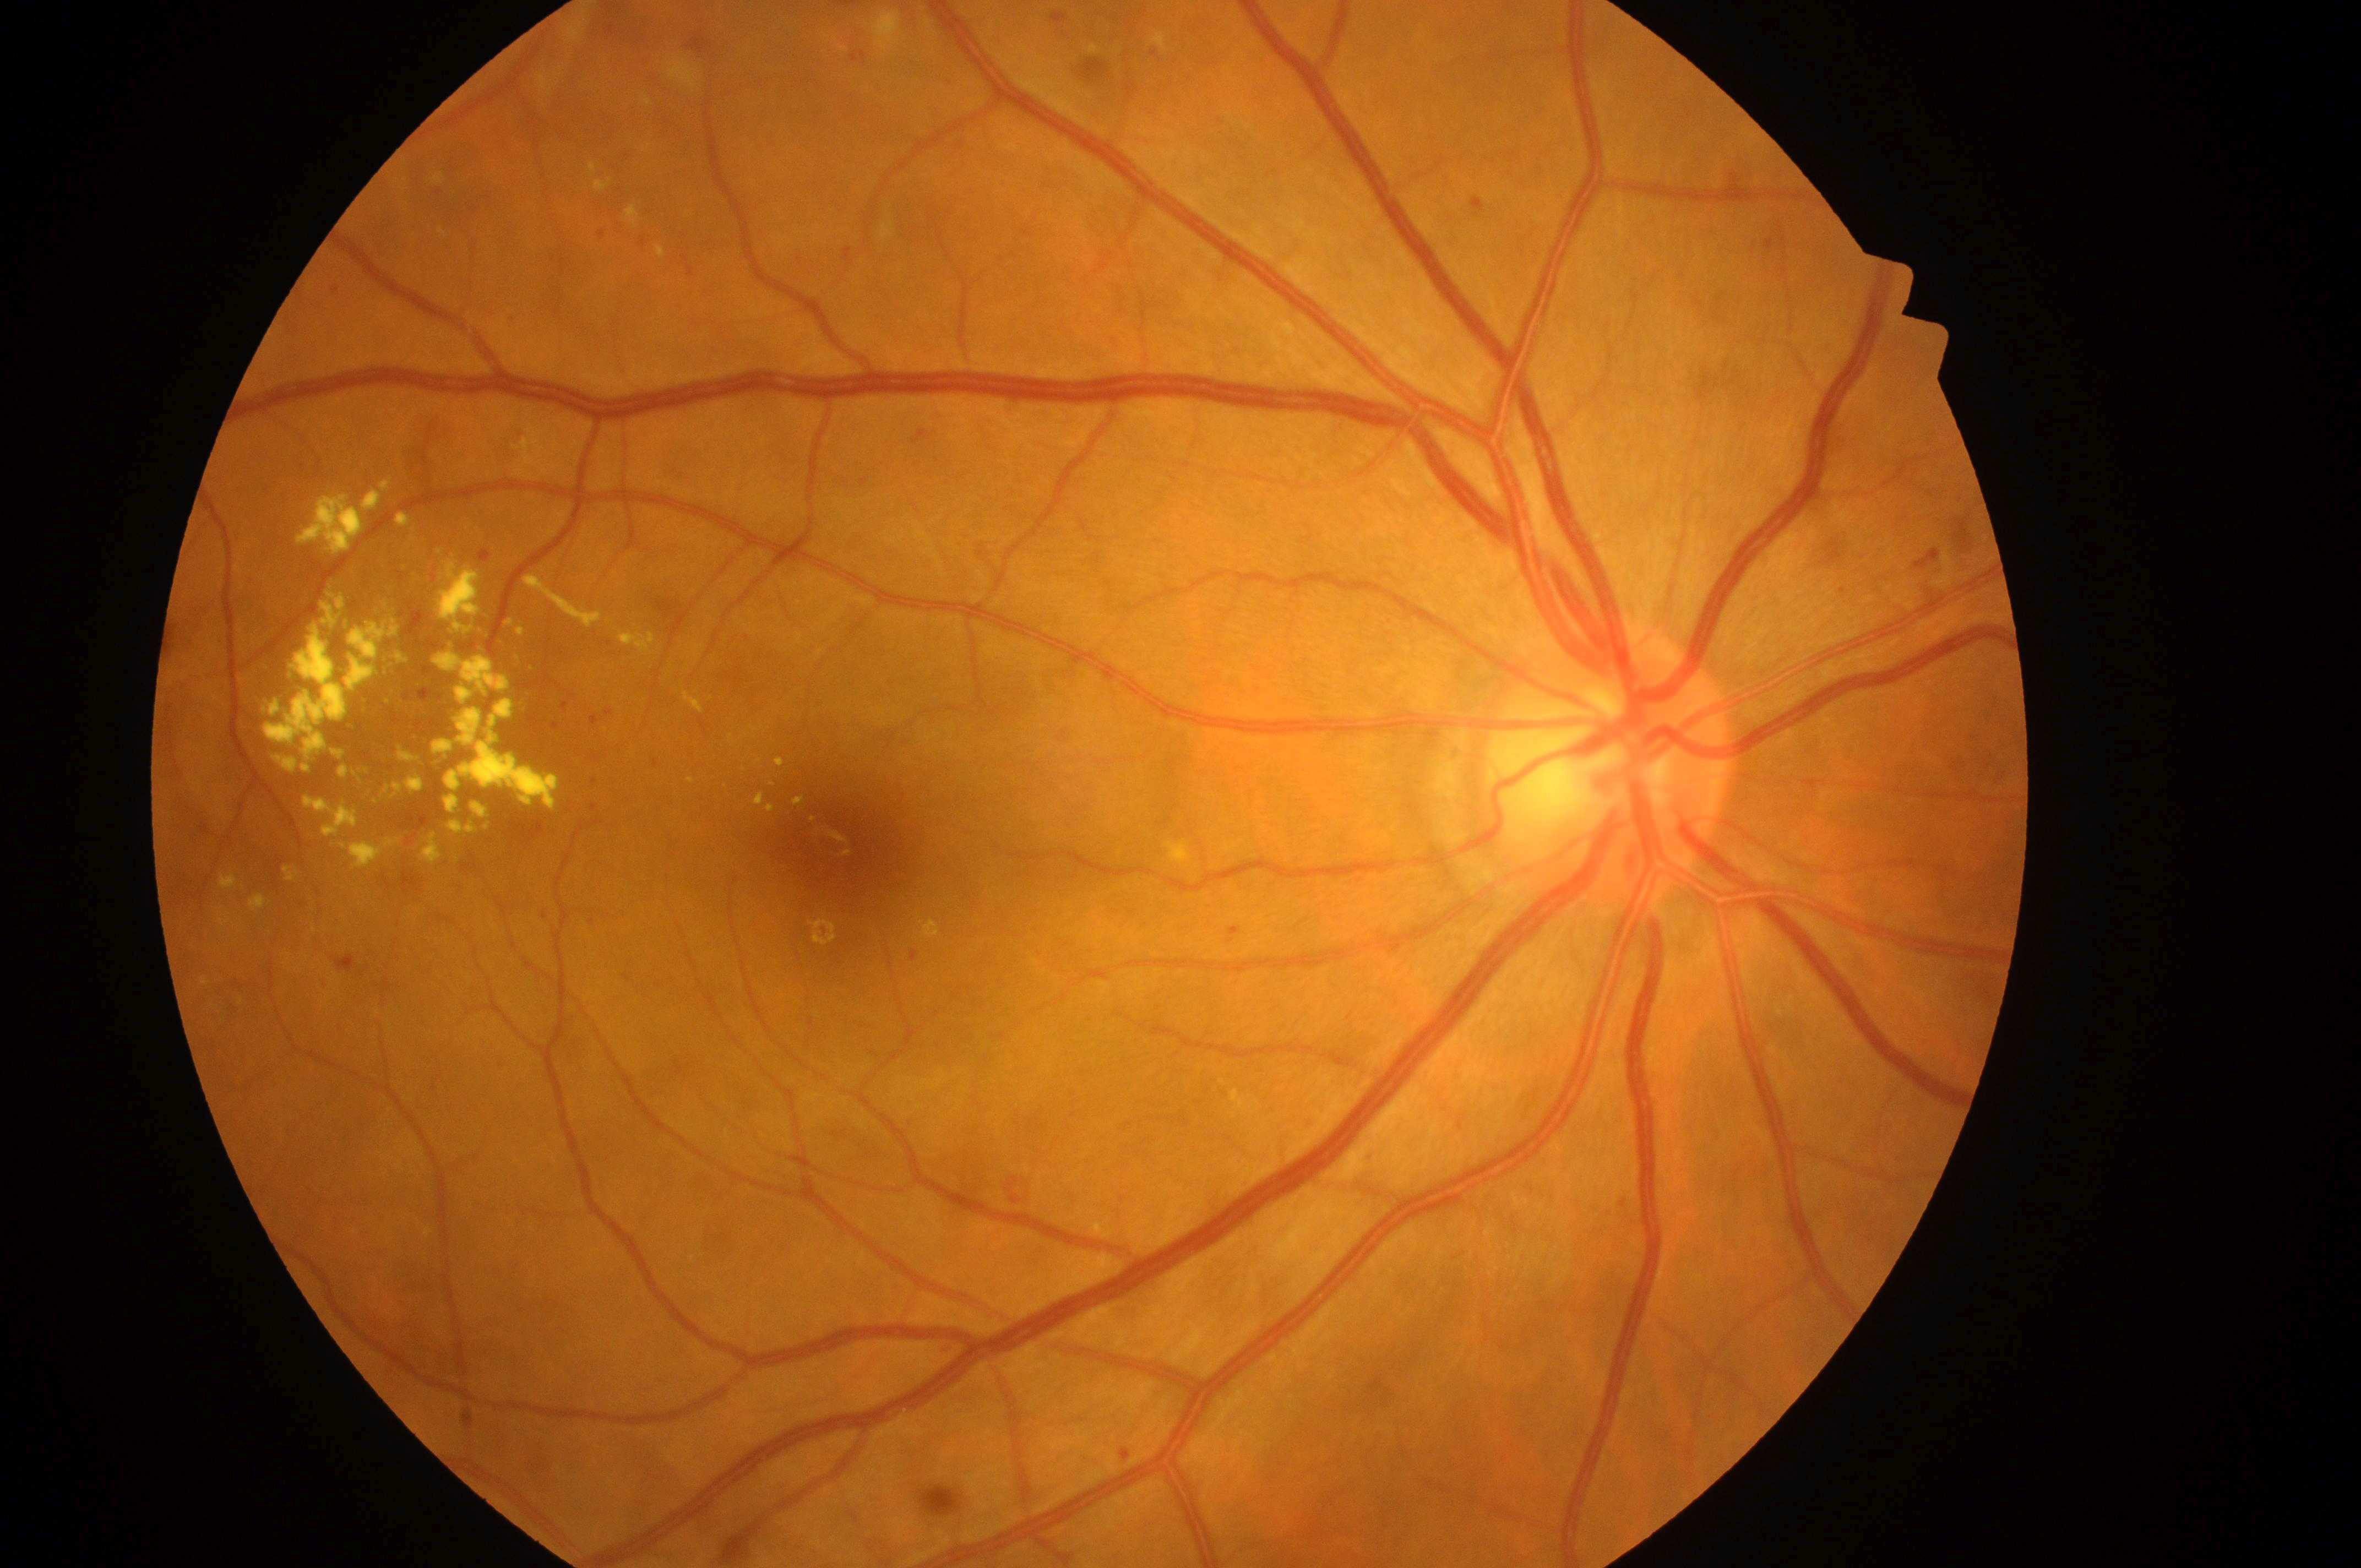
On the last post we covered an idea on how to detect the Fovea on fundus images using only image processing techniques and exploring some of its features, such as being darker than other regions of the retina. That approach was not the best and just worked for some examples, having a really bad performance in general.
After reading some papers that explore this kind of task, we found a non-explored way to detect the fovea without depending on image processing and using only technologies we have used to far. In this post, we will not be displaying example images on why using image processing did not work properly when applying to large scale datasets, but you can guess that the fovea visibility is different on each image and the fundus color is also an outstanding factor, so many of the images did not separate well the fovea from other regions of the retina or the background itself.
Related papers and method
At first, we discussed that Fovea detection is a harder task than OD detection, since we had no such data available, and this fact was still true. However, there is one dataset publicly available with some annotations on Fovea center coordinates, called IDRID. This dataset was used for OD detection, but using only the 81 segmented fundus images. The annotation on fovea and OD compose a set of 516 images total, now we just had to figure out a way to use those images.
On the research papers that explored this data to detect Fovea regions, most of the works had one thing in common: the use of U-Net, an encoder-decoder neural network, in order to deconstruct one image and generate another one, based on the Fovea localization. One of the approaches naturally was measuring the distance from each pixel of the image to the Fovea center, and using that as an input to the training network, so the decoder step could reproduce this distance, and the Fovea center (the object we are interested in) is actually obtained where the distance is 0.
Even though this was very interesting, it still diverges a lot from our research scope, that has been based on applying YOLO to detect objects. On another hand, another approach was using the Fovea center information to generate a heatmap around it, and also train a U-Net so that the decoder would generate a heatmap on the Fovea, and the Fovea center could be detected by only using a simple algorithm. This was interesting, but since we did not wish to use an encoder-decoder architecture, we just got the main idea behind it and generated heatmaps around it, using the parameters obtained by the paper’s authors, adjusted for a non-resized image. With that done, we binarize the image and generate bounding boxes information, just like we did before. The result follows:

Results
Now, we just had to adjust the object detection algorithm we had so we could train YOLO on optic disc, based on the two possible baselines, and fovea, based on the division given by the IDRID dataset. The whole training algorithm, using Ultralytics, is given as:
1
2
3
4
5
6
7
8
9
10
11
12
13
14
15
16
17
18
19
20
21
22
23
24
25
26
27
28
29
30
31
32
33
34
35
36
37
38
39
40
41
42
43
44
45
46
47
48
49
50
51
52
53
54
55
56
57
58
59
60
61
62
63
64
65
66
67
68
69
70
71
72
73
def getArgs(args):
    dataset_path = '/home/rodrigocm/datasets'
    baseline_path = '/home/rodrigocm/research/YOLO-on-fundus-images/data'

    if args.dataset == 'opticdisc1':
        dataset_path = os.path.join(dataset_path, 'opticDiscDetection/baseline1')
        baseline_path = os.path.join(baseline_path, 'od_baseline1.yaml')
        name = 'od_baseline1'

    elif args.dataset == 'opticdisc2':
        dataset_path = os.path.join(dataset_path, 'opticDiscDetection/baseline2')
        baseline_path = os.path.join(baseline_path, 'od_baseline2.yaml')
        name = 'od_baseline2'

    elif args.dataset == 'fovea':
        dataset_path = os.path.join(dataset_path, 'foveaDetection/images')
        baseline_path = os.path.join(baseline_path, 'fovea_baseline.yaml')
        name = 'fovea_baseline'
    else:
        raise ValueError(f"Unsupported dataset type: {args.dataset}")

    print(f"Traning for: {name}")

    return dataset_path, baseline_path, name

# Run the model on validation and test files, and save results
def test(model, baseline, baseline_name):
    print("-*-*-*- Resultados de Validação -*-*-*-")
    model.val(
        data=baseline,
        max_det=1
    )

    if baseline_name != 'fovea_baseline':
        print("-*-*-*- Resultados de Teste -*-*-*-")
        model.val(
            data=baseline,
            split='test',
            max_det=1
        )

# Train model and run results for test images
def main(args):
    model = YOLO("yolo11n.pt")
    dataset_path, baseline_path, name = getArgs(args)

    model.train(
        data=baseline_path,
        epochs=40,
        patience=10,
        optimizer='Adam',
        device=args.gpu,
        save=True,
        name=name
    )

    model.predict(
        source=f'{dataset_path}/test/images',
        conf=0.5,
        max_det=1,
        save=True
    )

    test(model, baseline_path, name)

if __name__ == '__main__':
    parser = argparse.ArgumentParser(description="Train a object detection model")
    parser.add_argument('--dataset', type=str, default='opticdisc1', help='YOLO dataset to be used for training')
    parser.add_argument('--gpu', type=int, default=0, help='GPU index to run the model training')

    args = parser.parse_args()

    main(args)
This code is only used if one wishes to reapply the same algorithm for both Fovea and Optic Disc detection. Now, notice that the heatmap is centered on the Fovea, but it may not be an exact fit of it. Running this information by my advisor, it should not be a problem, so we trained the model and still got interesting results.
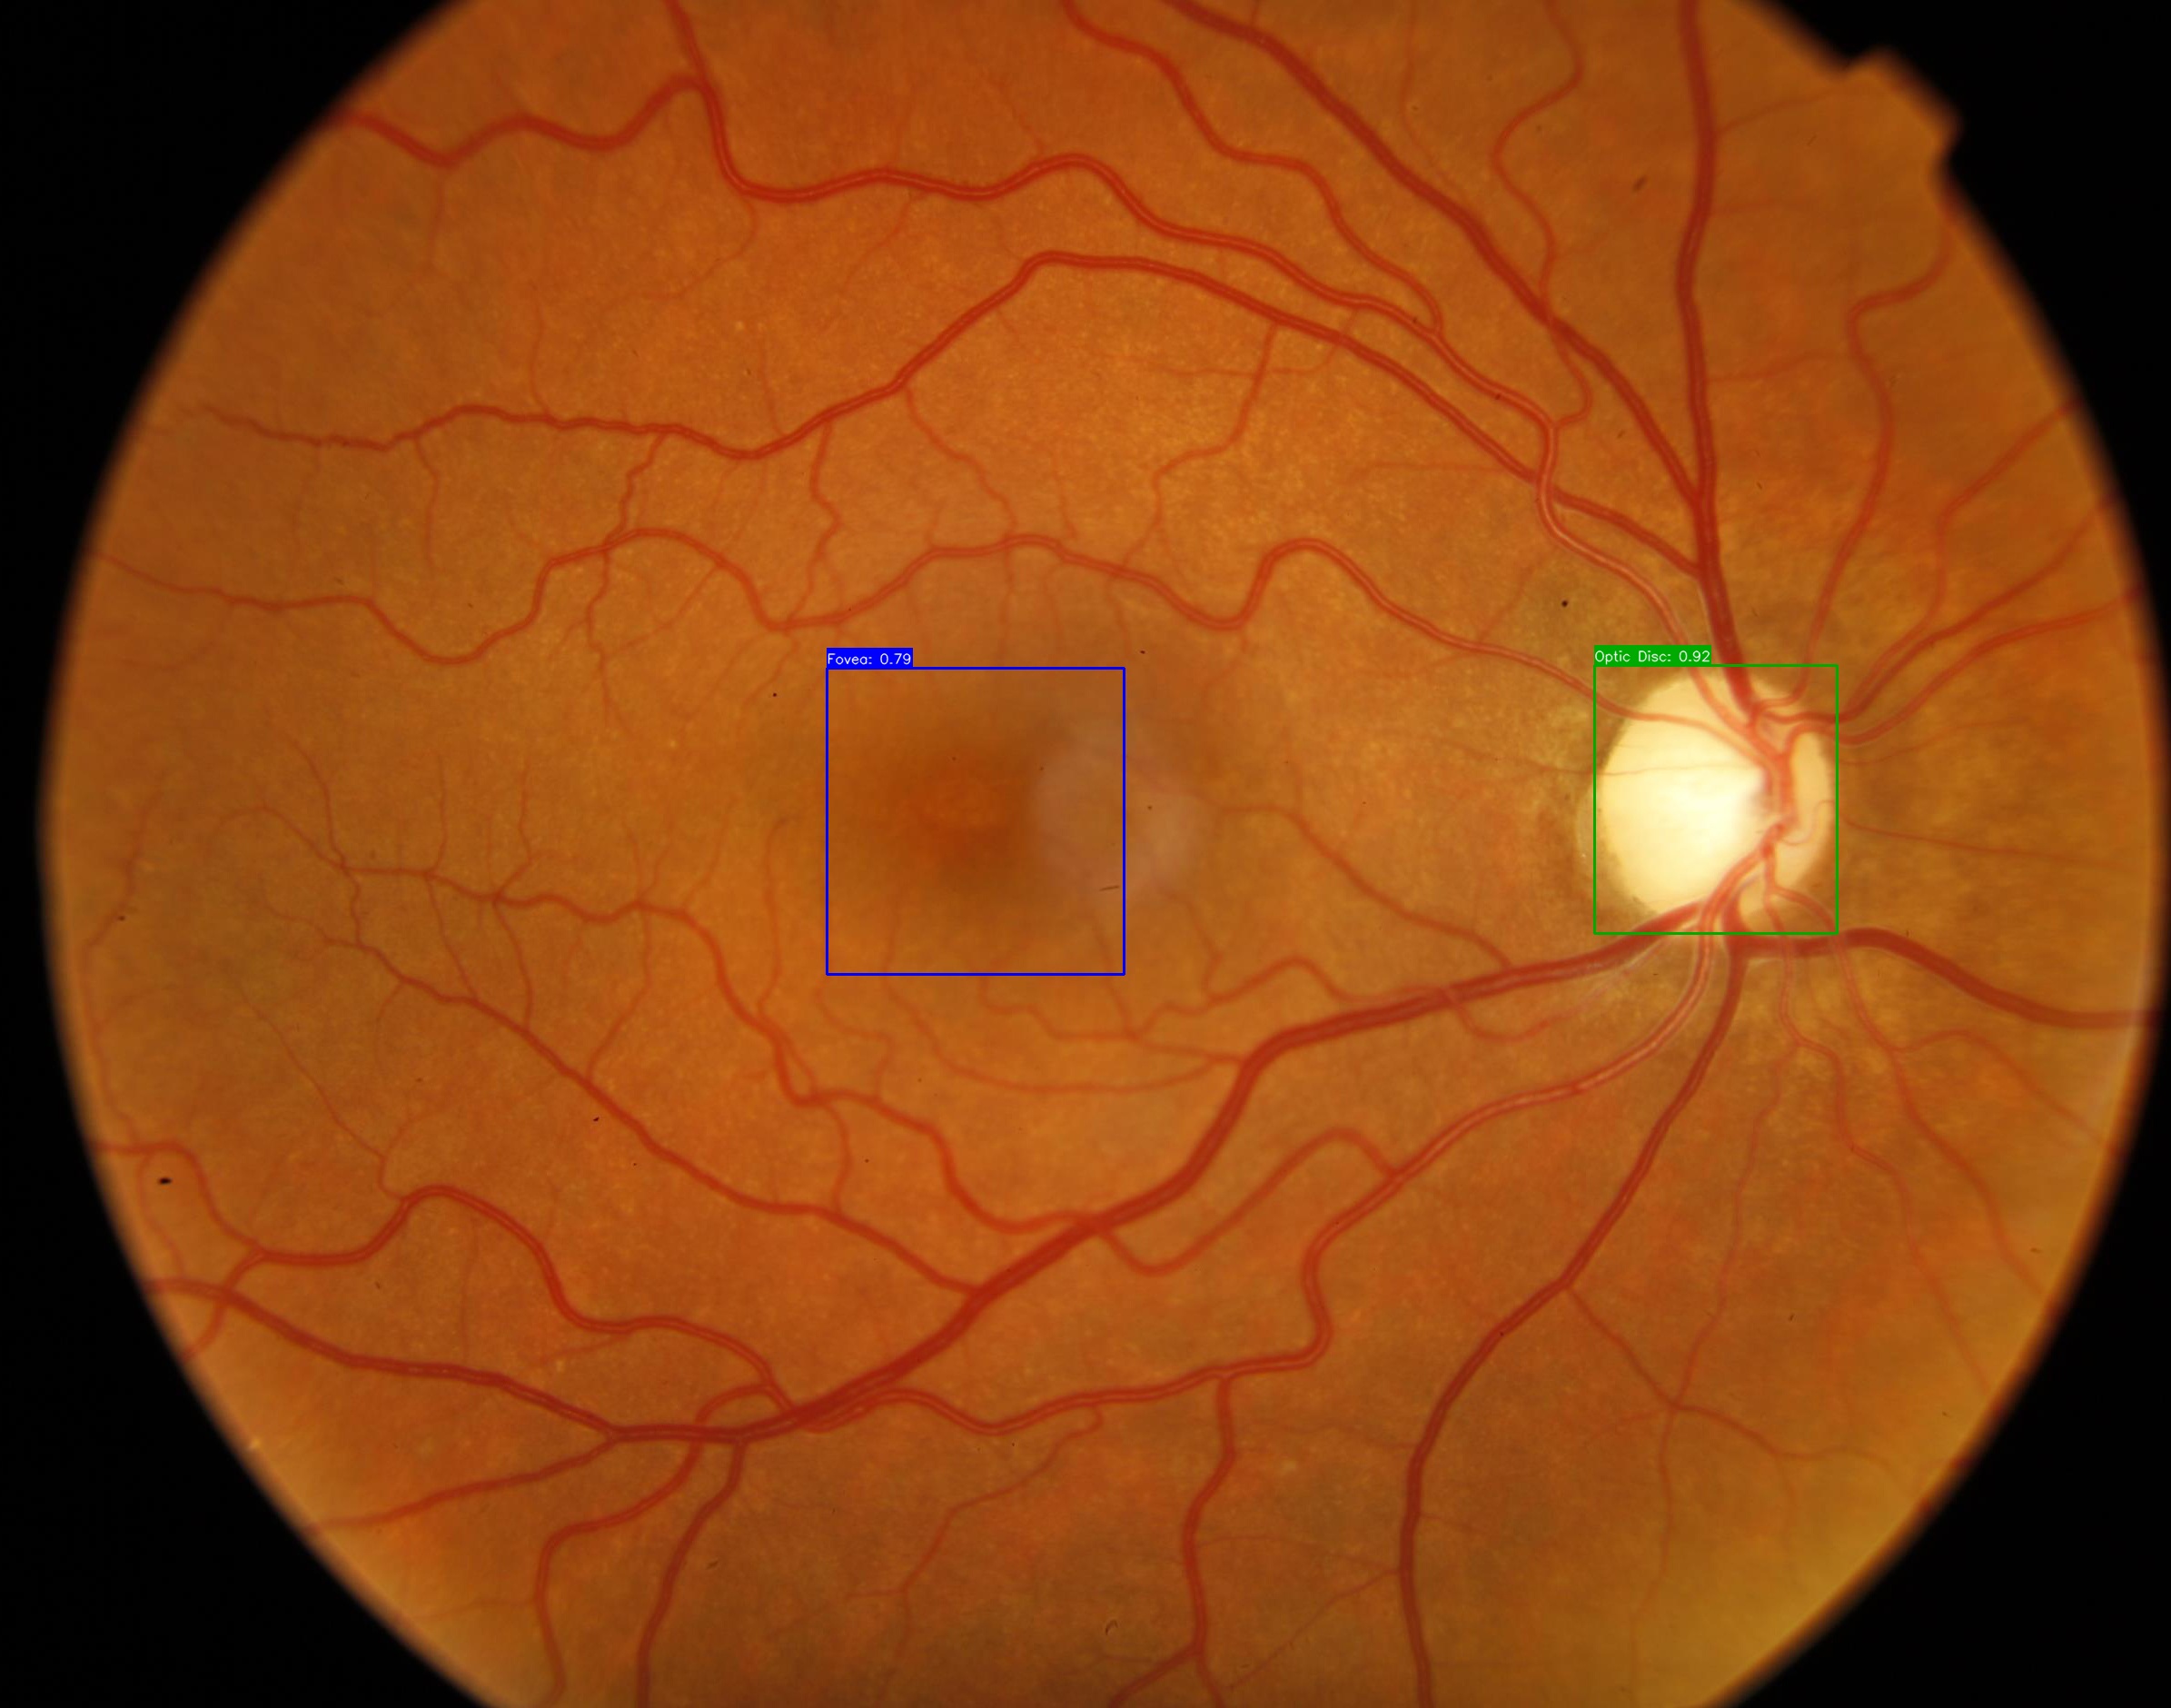 Fovea and OD detection at one image
The confidence score is lower on Fovea detection than on OD detection, but the result still works fine and we just need an approximation to the center coordinate, so it should be ok.
Now, if we think about the problems given on the prior method, the model should not work properly with poor fovea visibility, right? And indeed, it struggles a lot more, but on the other hand, using YOLO seems to be a great approach, since it shows great bounding boxes on the right region, even if it has a poor confidence score. The only cases where it truly does not work is when it can not detect any fovea at all, but since we are talking about quality assessment on images, if the visibility is that poor, the image should not be considered appropriate.
The following images show a batch labels and YOLO detected Fovea annotations, respectively, automatically generated by the Ultralytics library:
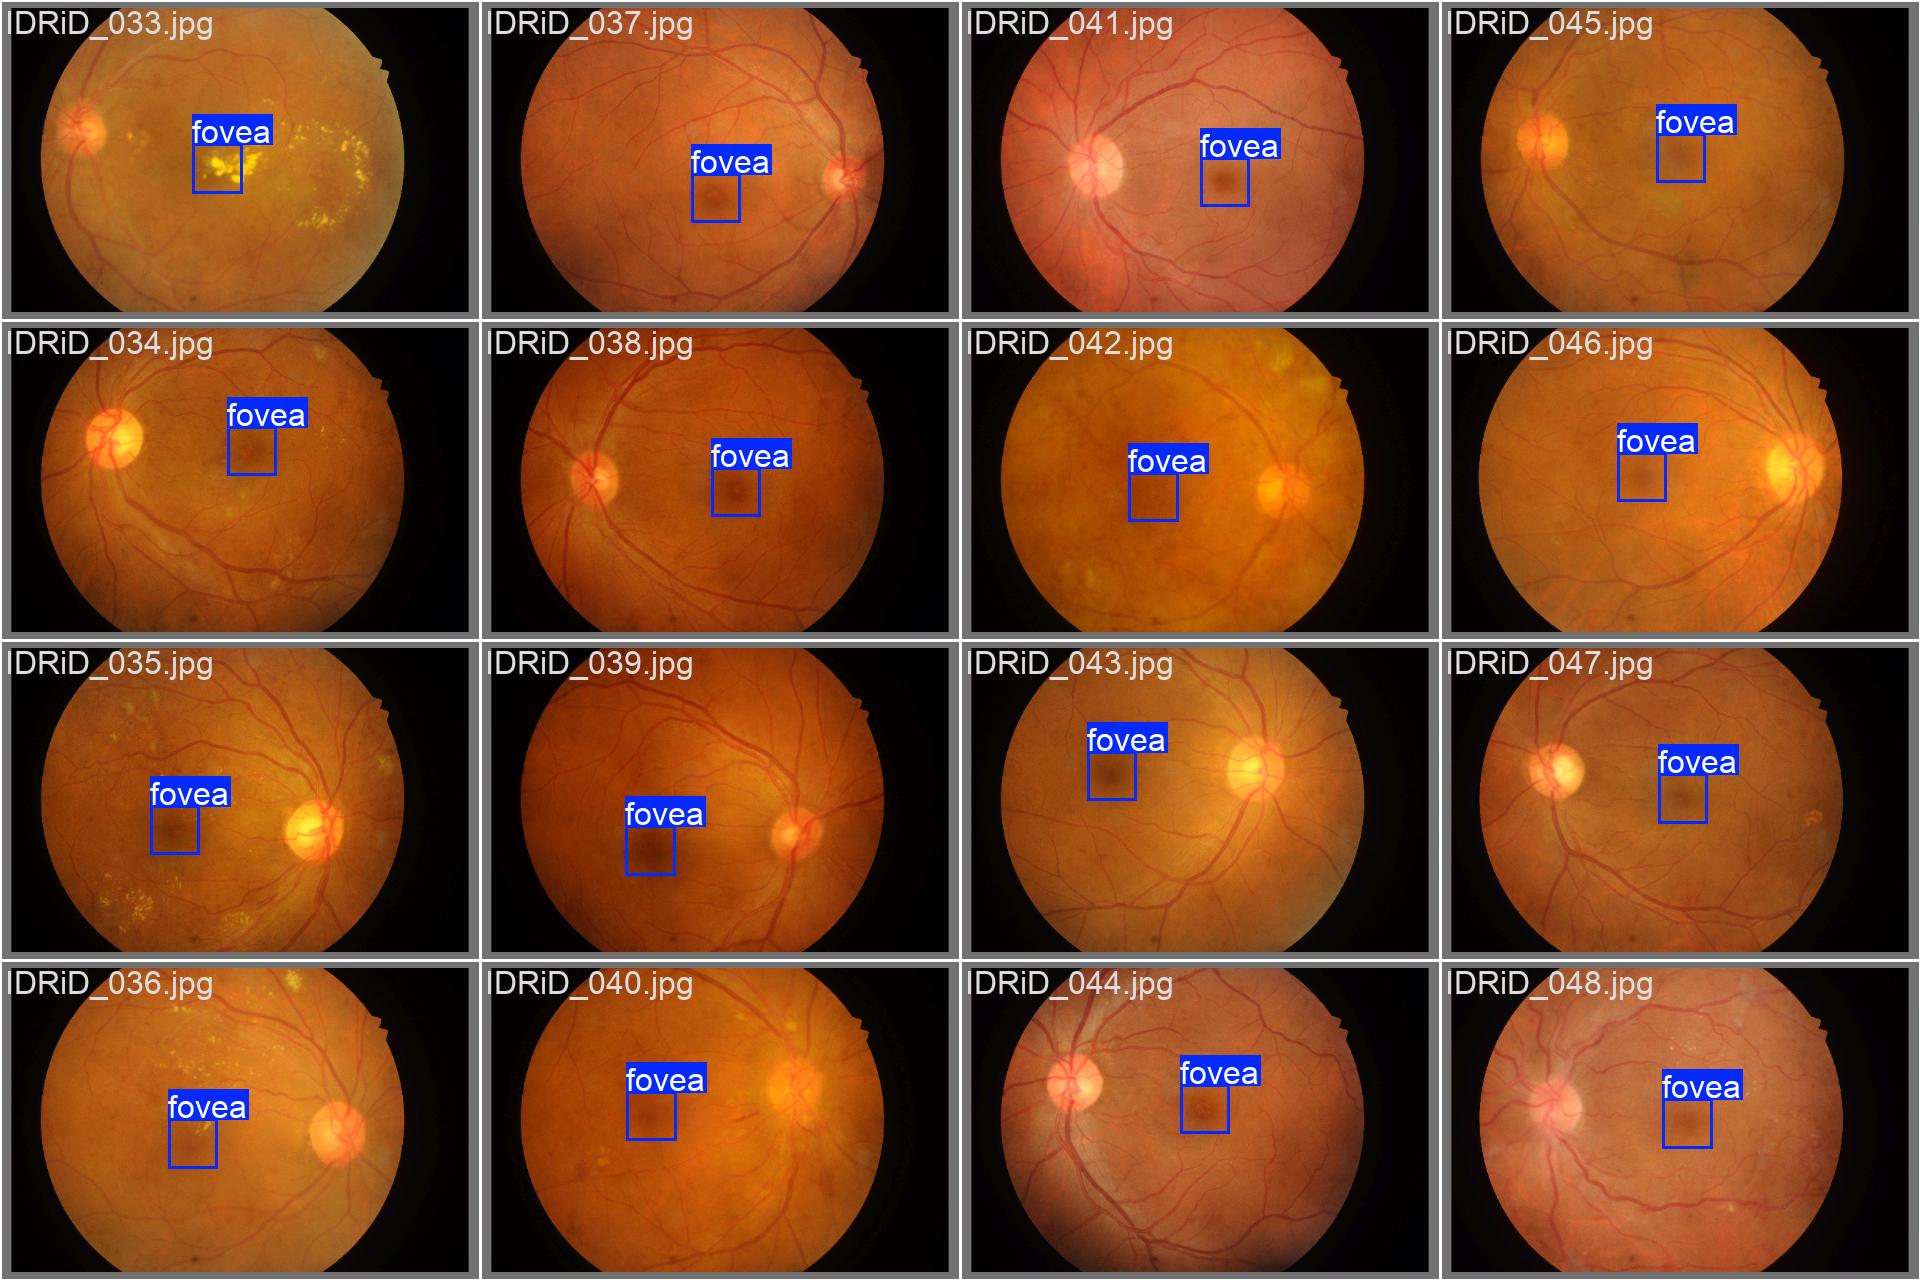
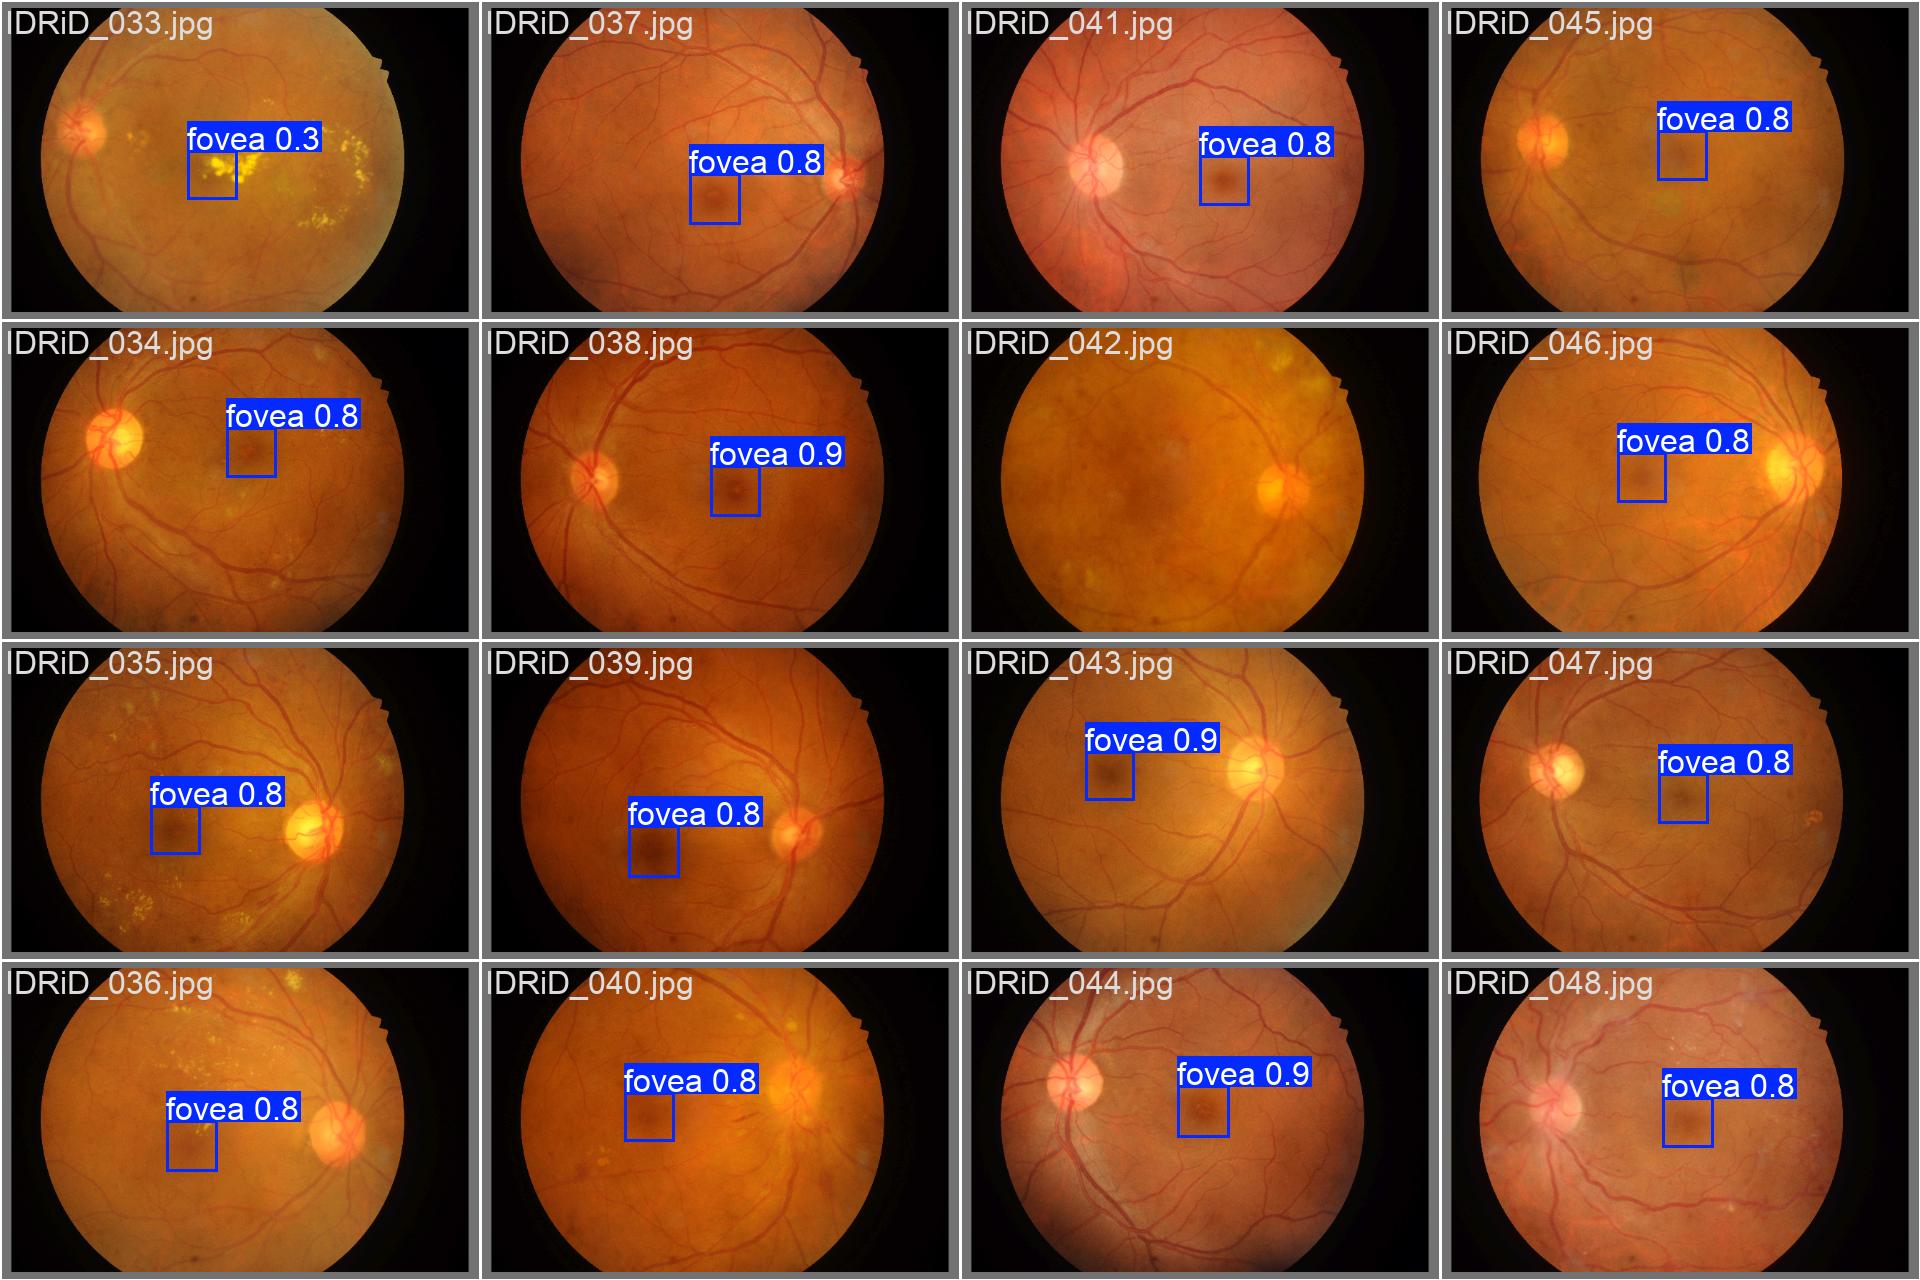
As we can see, even with a low confidence score, the predicted regions are pretty close to the labels, that’s why we decided to keep using this model.
Next Steps
We have just started to analyze the relationship between the Optic Disc and Fovea, and when those structures are not really horizontally aligned on the center of the image, the way we have used to implement the distance between the Optic Disc and the nasal edge may not be the real one. Instead, we can use a line between the OD and Fovea centers, and both the nasal and temporal edges should be the retinal edges area that cross that line. That would be a geometrical problem that, for the Optic Disc, would be better fitted by using the OD segmentation, which we do not have for now.
I am currently thinking about approximating the OD as an ellipse to calculate that distance and the actual Disc Diameter value, but I will be checking with my advisor first, since its an approximation. That will probably be the topic discussed on the next post :)
- Understanding and studying the problem
- Choosing dataset
- Preprocessing data
- Define training baseline
- Applying YOLO to detect Optic Disc (OD)
- Obtaining the disc diameter (DD)
- Obtaining distance from the OD to the Nasal Edge
- Detect Macular Center
- Obtaining the distance from the Macular Center to the Temporal Edge
- Assessing visibility for the inferior and superior arcades
This post is used as a research checkpoint for the image quality assessment research on retinal fundus images, supervised by professor Nina S. T. Hirata, from the Institute of Mathematics and Statistics at the University of São Paulo (IME USP). The project is supported by USP/MCTI/Softex/Motorola.