[TCC] Initial steps
This post talks about the first steps taken into the development of my bachelor thesis. We will be discussing about possible models to use and the conditions of the data we have available at the moment
It has been a long time since I last wrote something in this blog. Turns out I have been extremely busy with my internship and the time for research has vanished. We are now back to be bringing updates regarding the development of my bachelor thesis. In this post I will be covering a few topics I was supposed to take a look into, after my last meeting with my advisor.
Conversations with Diogo and Gustavo
This was one of the goals from the last meeting. For each POC, we needed different responses.
Gustavo talked to my advisor, and he seemed to be excited about the idea and would be happy to help annotating the data, in the format we are interested in. Maybe we can follow another format as well. I don’t know if it will be possible to get the data available as soon as we need though, so this is still an issue.
Diogo made the dataset from FMUSP available, removing PII data. We will use this dataset for our analysis, later in this post.
Model training
Our first idea was to use something like CLIP, a contrastive model that can approximate data that have the same semantic representation. However, at the same time that it is interesting, since we can calculate the similarity between an image and its description, it is also not ideal for our text generation purpose. We will then cover models that have a language decoder model integrated, or even LLMs.
PS: if we decide to go back to CLIP, this blog has an interesting implementation.
The basic idea follows:
Input image -> Transformer Encoder (ViT) -> Transformer Decoder (LLM).
It seems really simple looking at this high-level idea. Actually, some models already implement something like this. Let us take a look at some popular models:
Developed by Salesforce Research, this is a Vision Language Model (VLM). It uses Q-Former as a bridge, between the vision encoder and the LLM. According to ChatGPT, this is interesting to understand the construction of a multimodal model, and is not that hard to reproduce. It can be a great starting point for our research.
In general, we train the Q-Former, and freeze the encoder and decoder. In some approaches, we may unfreeze the last layers of the encoder, and use LoRA (Low-Rank Adaptation of LLMs) to train the decoder.
I still don’t know if any of that is true, and will have to study this further to give more details.
Wisconsin-Madison, Microsoft Research and Columbia University. This model follows a similar approach to BLIP-2. The model uses a pre-trained CLIP-ViT to encode images. The generated feature maps are mapped to the same space as the language embeddings by using a small fully-connected neural network, and all the embeddings are fed into a LLM.
For training, we have a similar approach to BLIP-2 as well, but we train the fully-connected network for most of the time, and by the end of training we unfreeze part of the LLM to tune it as well.
Developed by Google Deepmind, this is a Few-Shot Learning VLM. It integrates a vision encoder directly into an LLM, through Cross-Attention. ChatGPT stated that the scale in this model is huge and may need a lot of computational power to train. Maybe we can adapt this, but it would surely give nice results for our use case.
We also found this Blog post that explains better how this model works.
Did not read a lot of this, but for the way it is made available, it may be harder to customize the architecture. We can use this as a strong comparison prototype, a baseline to compare our results with.
Data Availability and Analysis
For training, we can use a transfer-learning strategy. To achieve value proposition, we may pre-train a model using COCO, a famous dataset with image captioning annotations. For each image, there are 5 example captions to train.
Let’s now deep dive into the dataset we have. We ran a simple dataset analysis, and much more can be added to that in the future. We have used mainly the eye_reports.csv file, from our internal dataset from FMUSP, since this file contains the ID for images, for exams, as well as two fields of interest: diagnosis and observation. Both these fields give natural language descriptions of the images, but do not follow the pattern stablished in our previous post.
First of all, the diagnosis field carries the same description format for all the images: “OLHO DIREITO:
1
2
3
4
5
6
7
8
pattern = r'OLHO DIREITO: (.*?)\tOLHO ESQUERDO: (.*)'

extracted = reports_df['diagnosis'].str.extract(pattern)
reports_df['diagnosis_right_eye'] = extracted[0]
reports_df['diagnosis_left_eye'] = extracted[1]

reports_df['diagnosis_right_eye'] = reports_df['diagnosis_right_eye'].str.lower()
reports_df['diagnosis_left_eye'] = reports_df['diagnosis_left_eye'].str.lower()
We initially thought that, since the dataset is indexed by exam_id, there would be 2 pictures per exam, one for each eye. To confirm that, we plotted the counts of how many images there were by exam:
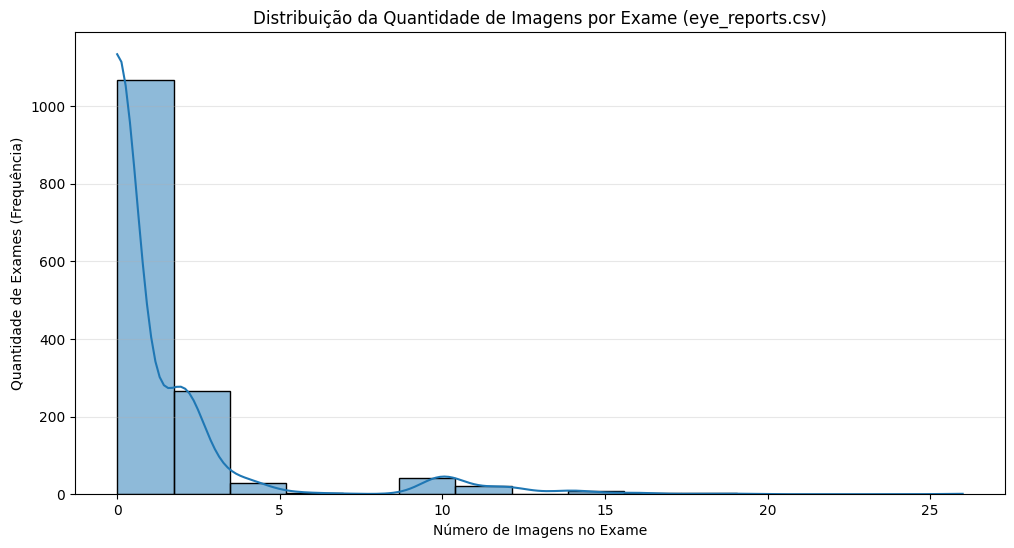 Number of images per exam distribution
The results show that actually many exams had multiple images. That way, many of the descriptions we have are related to lots of images, not only one, which may be a problem later. Also, for the image_id column, we have a list of the images referring to an exam, but we would need to manually check which images represent each eye, and therefore would get each description (considering still that may be more than one image per eye).
Going further, we also decided to take a look at the data distribution. For that, we plotted a graphic to have a sense of how many of the exams were given as “normal”, meaning there is no disease to analyze. From our dataset, there are exactly 1494 exams.
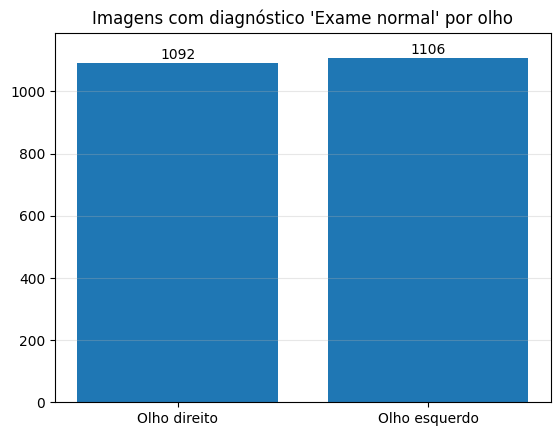 Number of normal exams per eye
Most of our data is for healthy eyes, so we don’t have much data to train a model yet.
From some other annotations given in the diagnosis column, we have that it may assume two different values that are not useful for analysis:
- “Exame alterado.”: the exam shows it is not a healthy retina, but there is no indication of what it is.
- “Impossível observar”: the images quality is low so there is no way to analyze it and obtain useful information.
Since these annotations provide us no useful information, we also plotted a bar graphic to have an overview of the impact this may be causing in the dataset:
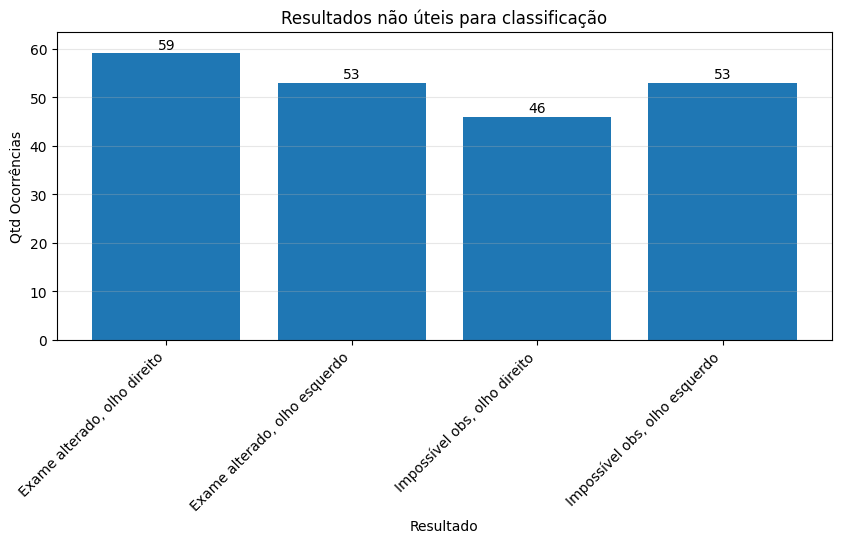 Number of exams with no useful information
Now, let’s take a closer look at the observation column. First of all, we get that 1143/1447 rows have a NaN value. Some information in this column however may be useful for our use case. Here is an example of what may be found there:
1
2
3
4
5
6
7
8
9
10
11
12
13
14
15
16
17
18
19
alterações microhemorrágicas e exsudativas de provável etiologia diabética e/ou hipertensiva. correlacionar com dados clínicos.

alterações hipopigmentares subretinianas em polo posterior em ambos os olhos. correlacionar achados com dados clínicos para relevância diagnóstica.

rarefação difusa do epr. correlacionar com dados clínicos.

exsudatos de olho direito de provável etiologia diabétia e/ou hipertensiva. correlacionar com dados clínicos.

alterações exsudativas foveais de provável etiologia diabética. correlacionar com dados clínicos.

alterações microhemorrágicas e exsudativas de provável etiologia diabética e/ou hipertensiva. correlacionar com dados clínicos.

imagens com qualidade ruim, impossível de inferir detalhes do exame. aparente retina aplicada.

alterações microhemorrágicas de provável etiologica diabétia e/ou hipertensiva. correlacionar com dados clínicos.

alterações exsudativas e microhemorrágicas de provável etiologia diabética e/ou hipertensiva. correlacionar com dados clínicos.

sem fotos de od
For the label “imagens com qualidade ruim, impossível de inferir detalhes do exame. aparente retina aplicada.”, it happens in the same row as the diagnosis with “impossível observar.”.
Conclusion
We still have no useful data to use. This dataset needs a lot of treatment to be a state-of-the-art dataset for our use case, and the annotations do not follow the quality pattern we want. Furthermore, we still need more data regarding retinal images that are unhealthy, otherwise we won’t be able to get a representative model.
References
Next Steps
Now that we have a better view of the problem we are dealing with, we need to be able to deal with the problems we have. The biggest one, for me, is the data. I will be bringing this analysis to my advisor and checking on her opinion on what we should do. Our goal is not to pivot from this project, but our time is also limited. I will also take a further look into the models proposed, while we keep deciding on the data, and look for public datasets that can achieve our value proposition.
- Analyze dataset feasibility
- Talk to POCs regarding data
- Gustavo, from FMUSP, to discuss data annotation
- Diogo, to understand the current status of the data we have available
- Understand and study the problem
- Review model architectures (papers and blog posts)
- Decide which model may be a baseline and which is our goal-model
- Look for public datasets
This post is used as a bachelor thesis checkpoint for the image captioning on retinal fundus images, supervised by professor Nina S. T. Hirata, from the Institute of Mathematics, Statistics and Computer Science at the University of São Paulo (IME USP).