[IQA #1] How to process image quality assessment (IQA) on retinal images
This is an introductory post for my IQA Research project, based on applying computer vision and deep learning techniques to assess quality on retinal fundus images.
When applying Machine Learning (ML) techniques on medical images, the whole context needs a lot of attention, since a mistake is directly related to someone’s health. Our goal, in this research project, is to guarantee that, when using ML to classify diseases in retinal images, we get the best model possible, i.e. we are able to train a model with the best possible images, so the error/loss is not increased due to low image quality. With that in mind, I have been doing an undergraduate project for over a year now, applying deep learning to retinal images, in order to assess its quality. As a first part of the project, I have trained a CNN classifier on the BRSet dataset, and explored image explainability using GradCAM. The results showed that the model was not performing correctly, so right now we are exploring new techniques to assess quality to the same images.
Image Field definition
The BRSet dataset defines 4 main parameters in order to assess image quality to retinal images. If the image fails in one of those parameters, then the image is classified as Inadequate. The parameters are defined as follow:
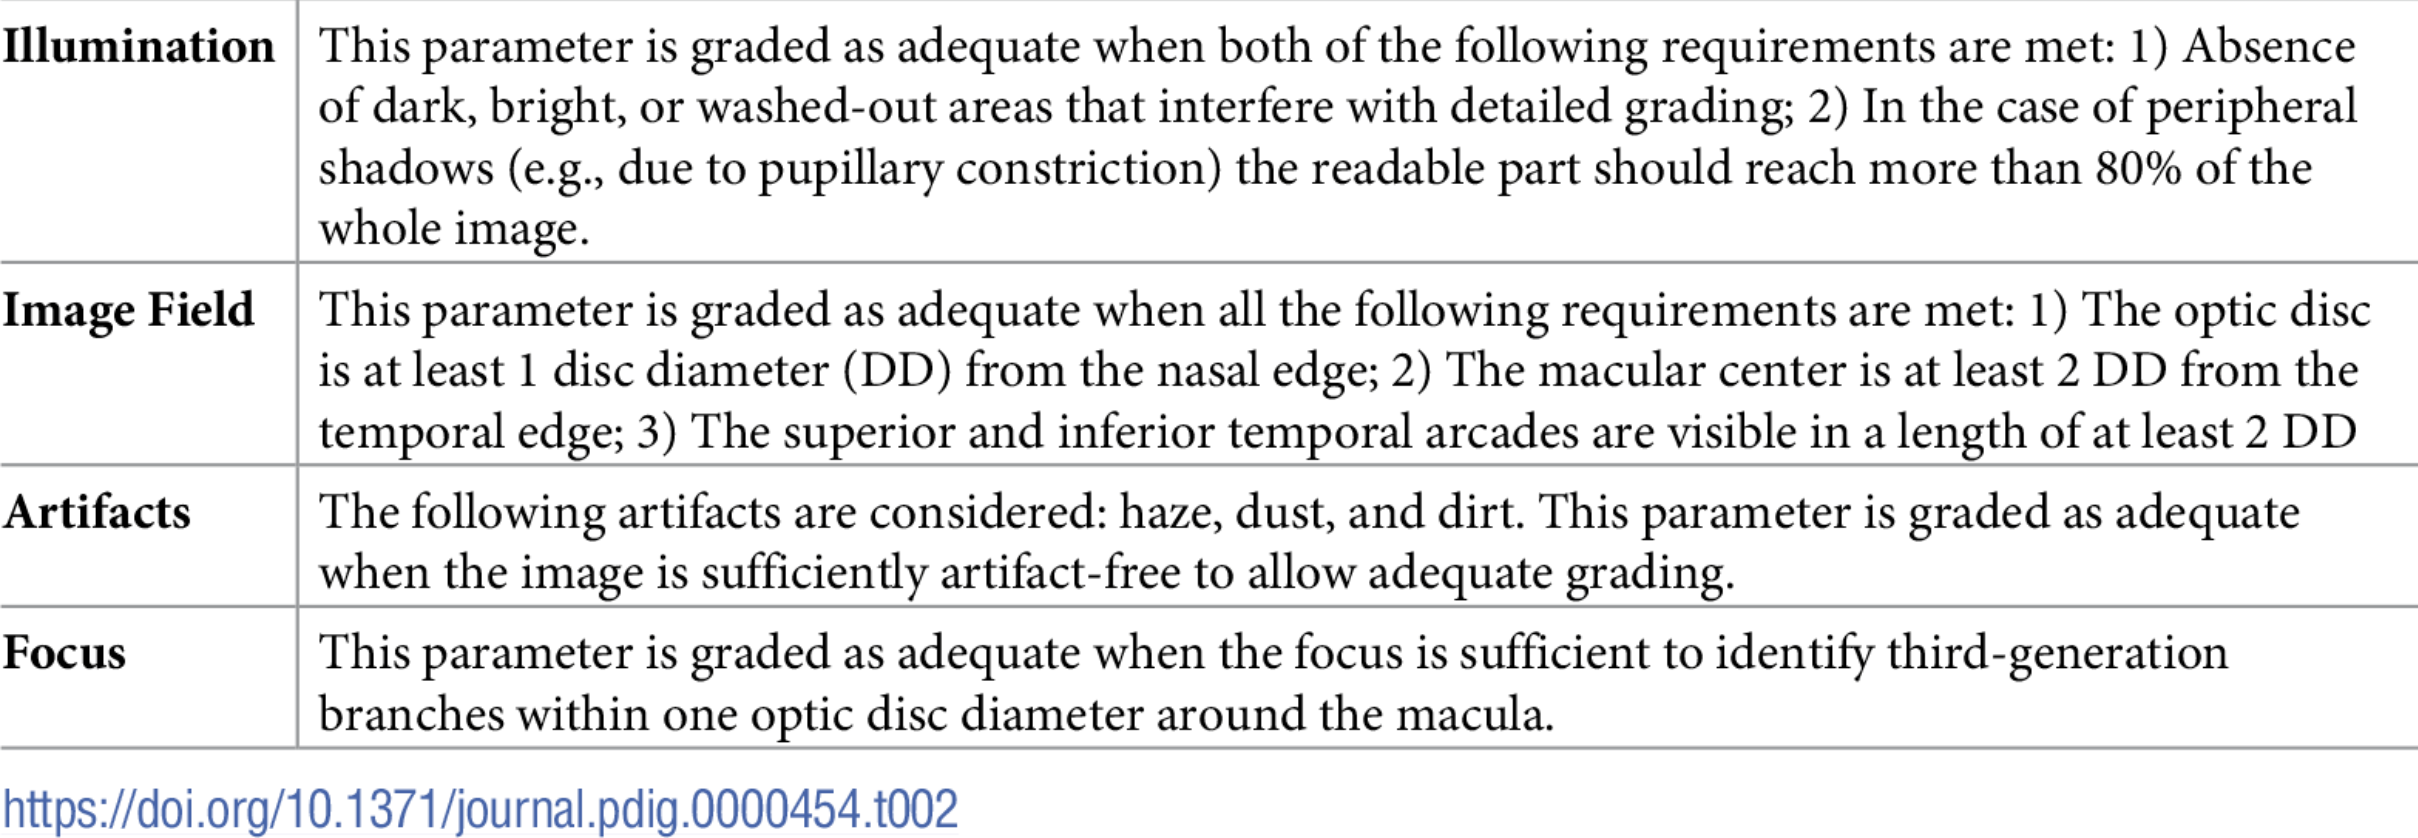 Quality assessment parameters for BRSet
If you take a closer look at the Image Field parameter, you will notice that this parameter specifically does not depend on visual features that can be adquired by the use of basic convolutional operations, mainly because it is not defined only as a pattern recognition task, but also a positional task. We are interested in knowing the position of the Optic Disc, the Macular Center and the size of the superior and inferior temporal arcades in the retinal image.
According to Dr. Luis Filipe Nakayama, one of the BRSet researchers, this specific parameter is specific for the diagnosis of Diabetic Retinopathy. On the other hand, this is the parameter that gets the most images to be classified as inadequate, so it is still worth working on top of it.
Datasets and Processment
As a first step on solving the Image Field problem, we are focusing on detecting the Optic Disc on the retinal image. Note that the optic disc is the shiniest part of the image, so the detection of this should not be that hard.
My advisor’s told me to try and apply YOLO, which is an object detection model, based on the use of CNNs, that can be applied to an image in order to place a bounding box on the object we are interested in detecting. For this task, we were only able to find one public dataset containing annotations for optic disc bounding boxes. On the other hand, since the optic disc is a circular structure and we were able to find other datasets containing segmentation masks for this structure, obtaining the bounding boxes were a no brainer.
For this research, we have used the following datasets:
- REFUGE2: 1200 images
- G1020: 1020 images
- IDRID: 81 images
- DRISHTI-GS: 101 images
- RIGA: 750 images
- MAGRABIA
- MESSIDOR
The RIGA dataset is composed by 3 different datasets: Magrabia, Messidor and BinRushed; that contain images annotated by 6 different doctors and the original images. In order to obtain the labels for YOLO, we used the images difference, to obtain a segmented-like image, and define the bounding boxes coordinates. By applying that, we have decided not to use the BinRushed dataset, because, when extracting the difference image, we got a lot of noise on the image. That could have been resolved by applying image processing techniques, such as median filter, but we would need to analyze if that worked properly on every image, and we had plenty of data already.
For G1020, the dataset already had annotations for bounding boxes, so we only needed to convert the .JSON annotations to a .txt, and write a script to parse the labels to the YOLO expected format.
Last but not least, for the remaining datasets, we only wrote a script in order to obtain the bounding boxes coordinates from the segmented images and write it to a file.
With all that processing done, we got the dataset we expected, and we were now ready to train the YOLO model and analyze results. This process will be explored on future posts, and the results obtained will also be shared, alongside images illustrating the Optic Disc detection.
Next Steps
- Understanding and studying the problem
- Choosing dataset
- Preprocessing data
- Define training baseline
- Applying YOLO to detect Optic Disc (OD)
- Obtaining the disc diameter (DD)
- Obtaining distance from the OD to the Nasal Edge
- Detect Macular Center
- Obtaining the distance from the Macular Center to the Temporal Edge
- Assessing visibility for the inferior and superior arcades
This post is used as a research checkpoint for the image quality assessment research on retinal fundus images, supervised by professor Nina S. T. Hirata, from the Institute of Mathematics and Statistics at the University of São Paulo (IME USP). The project is supported by USP/MCTI/Softex/Motorola.